MODEL-TO-MODEL SCOPE RECONCILIATION | NORTHERN ONTARIO GOLD MILL
In the aggregate current model, total straight-pipe length increased 38.3%. Selected component, connection, cable-tray and support quantities increased 155.0% to 475.4%.
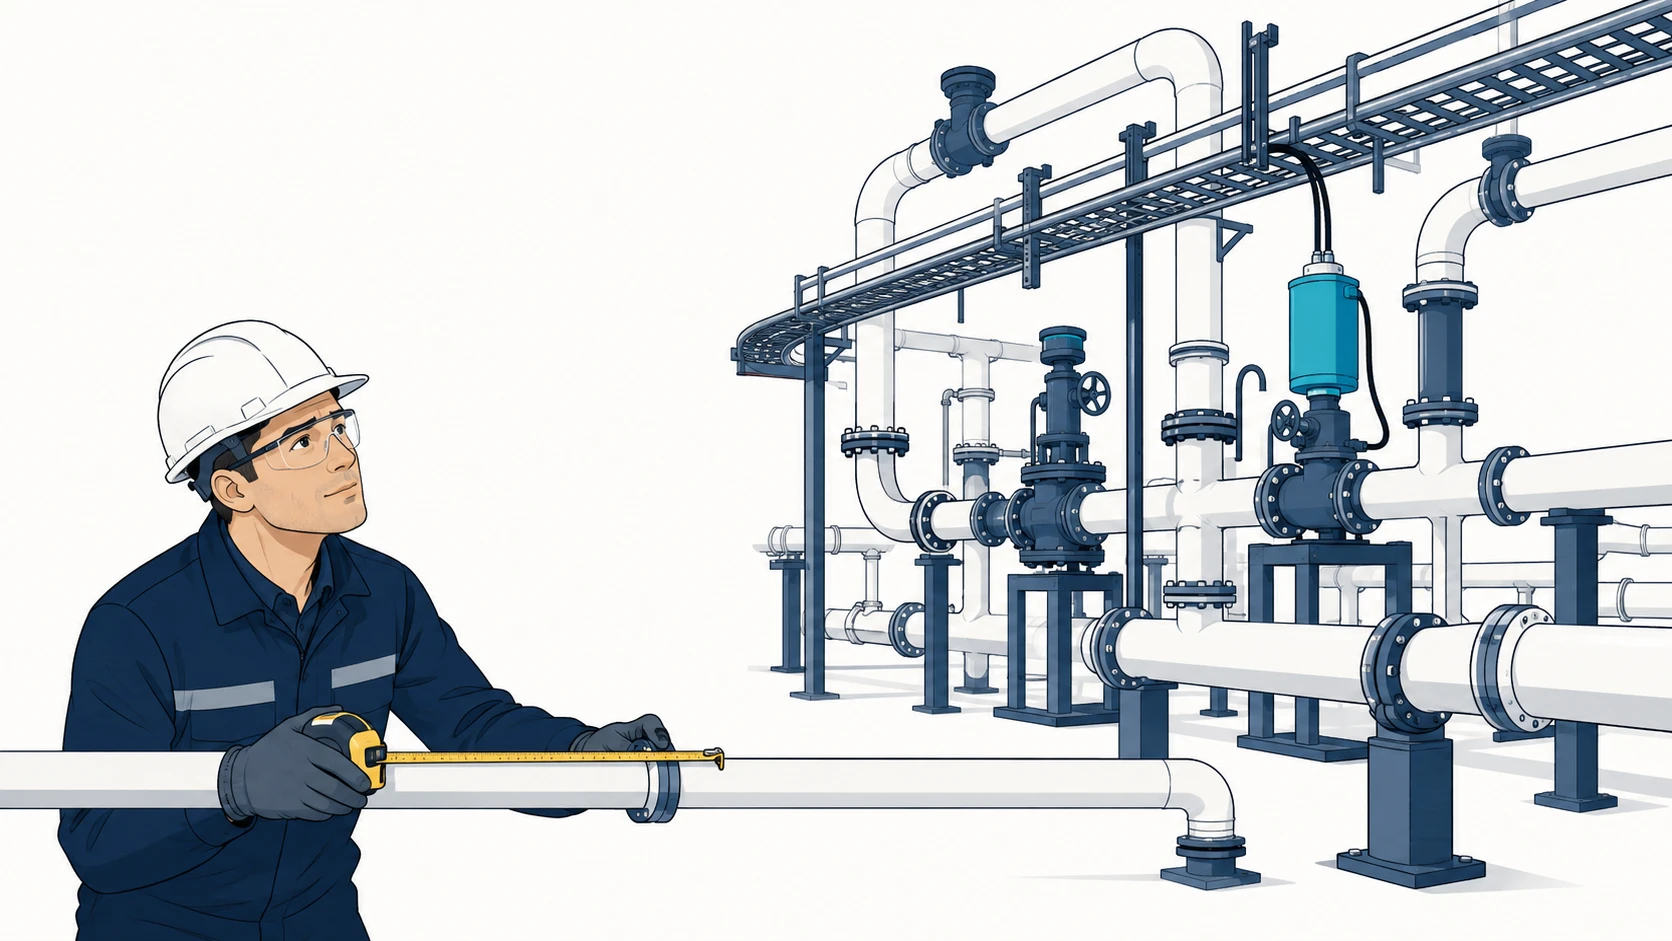
Straight-pipe footage described route length. The model and drawing-BOM quantities described the components, connections and supporting infrastructure that had multiplied around it.
Download the full case study ↓The original-scope Plant 3D model served one lime-addition destination: the Trash Screen, also referred to as the Trash Bin. The aggregate current model combines that baseline with two later routing additions. Combining them provides a complete view at the comparison date, but it does not reclassify the separately authorized CIP work as a change to the original scope.
Total straight-pipe length rose from 427′-8.92″ to 591′-8.05″—an increase of 163′-11.13″, or 38.3%. That was a real increase, but it did not describe how much the network changed internally.
Creative GOAT converted a general assertion of “more work” into a model- and drawing-derived comparison that could be evaluated using a clear baseline, comparator and scope lineage.
FULL REPORT
Straight-pipe footage increased 38.3%, but it was an incomplete description of the aggregate model. Several component, connection, cable-tray and support quantities increased by much larger percentages, showing why route length alone could not describe the modeled scope and routing complexity.
We will email you a copy as well, so you can find it later.
Does route length appear to understate the change visible in your model or BOM?
We use necessary cookies. With your consent, Google Analytics helps us understand site use. Cookie Policy · Privacy Policy
Manage your cookie preferences below:
Essential cookies enable basic functions and are necessary for the proper function of the website.
Statistics cookies collect information anonymously. This information helps us understand how visitors use our website.
Measures how visitors find and use the site: pages viewed, quote and contact form submissions, phone and email clicks, and case study downloads. The _ga and _ga_J0S6QKJ3QC cookies are only set once you accept statistics cookies. Before that, Google receives an anonymous signal with no cookie or identifier attached.
Service URL: policies.google.com (opens in a new window)
You can find more information in our Cookie Policy and Privacy Policy.